Promising New Stock Market Indicator and Screener - VPRS - Volume, Position, Range, Signal
Most of Stock Market Technical Analysis Indicators used today are relatively ancient, with most of them being developed 20-50 years ago, well before the age of computers.
A new simple indicator VPRS (Volume, Position, Range, Signal) has been developed that uses Price Trends, Rate of Change in Volume, the Close Price Position on the Range and changes in the True Price Range.
The indicator can be used for monitoring trends and screening stocks for BUY signals. The indicator is powerful, yet easy to understand and complements other indicators.
One of the advantages of this method is that it combines information that most people are familiar with on charts that display the familiar OHLC Bar Charts and Volume.
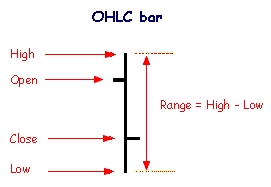
Daily Bar Charts - OHLC
- Opening price
- Highest price
- Lowest price
- Closing price
How can Bar Charts be Used?
Bar charts have been used for hundreds of years and provide the foundation of most charting systems designed to monitor prices and to make BUY and SELL decisions. Some of the ways in which OHLC Bars can be interpreted are:
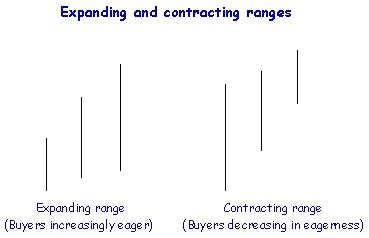
Expanding and Contracting Ranges
One important aspect is the price range - that is the differences between the high and low price for the day or hour.
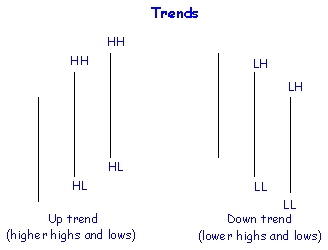
- Expanding ranges in an up trend signals increasing eagerness from buyers (price rise
- Expanding ranges in a down trend signals increasing eagerness from sellers (price fall)
- Contracting ranges show decreasing eagerness from both buyers and sellers.
The rate of change in the price range is a good indication of like price changes.
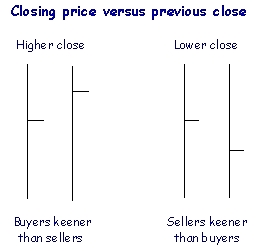
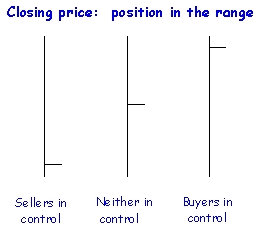
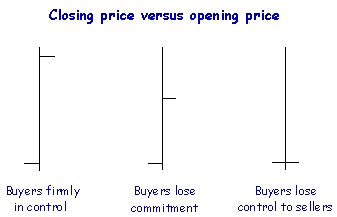
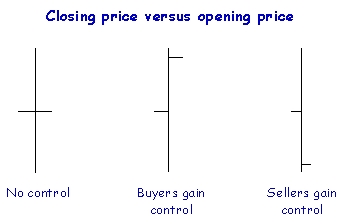
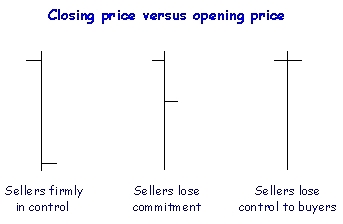
Position of the Closing Price Compared to the Range
The eagerness and dominance of sellers or buyers at any time is often shown by where the closing price occurs on the range of the bar between the high and low.
- A closing price towards the top of the range, close to the maximum price (high) it indicates the increases eagerness of the buyers. Committed traders will buyer into the close of the market, reducing their profits and cause the price to rise towards the maximum price (high) for the day.
- A closing price towards the bottom of the range generally indicates that the sellers are dominant. Committed traders will sell stocks into the close to get the best price they can and this will cause the price to fall towards the low for the day.
- If neither buyers or sellers are eager then prices will tend to close towards the middle of the range. Profit taking will often retrace part of the loses or gains for the day and shift the price back to middle of the range.
Why is Volume Important?
Volume is second only to price as the most valuable parameter for monitoring the market.
- Large volumes generally indicates that there are a large number of traders involved, including financial institutions that have large portfolios. The larger investors and institutions are responsible for the highest turnover of stocks to the market. If the Big Guys are trading, the price is likely to change substantially heading up or down.
- Small volume signifies that there are very few traders in the market. Few buyers nor sellers are trading and so the price is unlikely to change. If the volume is low, it generally means that the Big Guys are not involved and the price trends will generally be weak.
Relationship between Volume and Trend
Volume also helps to show the health and strength of a trend.
- An uptrend can be regarded as strong and healthy if the volume increases as the price follows the trend upwards and volume decreases when price goes against trend (correction). Buyers are committed and willing to pay higher prices to secure the stock, forcing price rises.
- When prices rises cause volumes to decrease, it generally signifies that a trend is unlikely to continue. Prices may continue to increase slowly, but sellers will often pull the price down.
- A downtrend in prices is generally healthy and strong if volume tend to increase as prices fall and volume decreases when prices begin to retrace upwards.
- When falling prices are accompanied by decreasing volumes, the downward price trend is unlikely to continue. Prices will either start to rise or continue to fall, but at a slower rate.
- When volumes increase, it means lots of traders are actively selling and buying the stock.
- When the volume spikes at certain price, it generally indicates a potential resistance point for the stock.
Support and Resistance
Monitoring a volume and price simultaneously allows a trader to identify Support and Resistance levels. These Support and Resistance prices are key boundaries where the forces of supply and demand meet to affect prices and trading. In financial markets prices are driven down by excessive supply and up by excessive demand. Demand is therefore associated with bullish tendencies, bulls and buying. Supply is the opposite being generally synonymous with bears, bearish tendencies and selling. Generally as demand increases, prices rise and as supplies rise, the prices generally fall. When supply and demand are balanced, prices generally trend sideways as neither the bulls or bears can get control.
What Is Support?
Support is the price at which active demand is big enough to stop the price from falling any further. The concept is that as the price falls towards the support level, buyers become more interested in buying and sellers become less interested in selling. At support level demand has risen to overcome supply and this stops the price from decreasing below the support level.
What is Resistance?
Resistance is the price at which active selling becomes large enough to stop the price from increasing any further. The concept is that as the price increases towards the resistance level, the sellers become more interested in selling and the buyers become less interested in buying. At the resistance level supply tends to overcome the demand and this stops the price from rising above the resistance level.
Trading Range
A trading range is a range of price boundaries within which the stock price remains for a period of time. The existence of a trading range between support and resistance shows that supply and demand are active and are evenly balanced to control the price. When the price breaks out of the trading range, moving below or above the boundaries it signifies that a winner (either demand or supply) has taken control and the balance has been broken.
VPRS - Combining the Volume and Bar Chart Signals into an Index.
The indicator uses the following components.
- The absolute rate of change of volume as a percentage
- The relative position of the close on the True Range as a percentage
- The absolute rate of change of the True Range as a percentage
The three percentages are simply added and divided by 300 to give a VPRS score as a percentage.
The formula are shown below
Volume (Vc) - This is the rate of change of volume expressed as a percentage
V1 = 100* ABS(volume - volume[1]) ................ absolute difference in volume
V2 = 1 + average[2](volume) ......................... average volume on two previous days
V2 = (2 + volume + volume[1] ) /2
Vc = V1 / V2
Volume [1] is the volume on previous day
Average [2](volume) refer to the average volume on the two previous days
Position (Pc) - This is the position of the close on the Absolute True Range (taking account of the low and high on the previous day
P1 = 100 * ( MAX ( high, close[1]) - close ) + 0.001
P2 = MAX ( high, close[1] ) + 0.001 - MIN ( low, close[1] )
Pc = 100 - (P1 / P2 )
close[1] is the close on the previous day
True Range (Tc) - This is the rate of change of the true range expressed as a percentage
T1 = max( high, close[1]) - min ( low, close[1] ) ............... true range on last day
T2 = max( high[1], close[2]) - min ( low[1], close[2] ) ....... true range on previous day
Tc = (100* ABS(T1 - T2) + 0.001) / (T1 + 0.002 + T2)/2 )
VPRS = ( Vc + Pc +Tc ) / 3
Smoothing - The components are simply added and the signal smoothed using a 3 period moving average.
VPRS = (VPRS + VPRS[1] + VPRS[2]) /3
How to Use VPRS
As applies for any signal VPRS should be used as only one of a suite of indicators when using a chart system. There are many reasons for price fluctuations including various announcements and whole of market effects and so no indicator is perfect.
The Key points regarding the use of VPRS are:
- The indictor needs to be used in the context of understanding trends, cycles, support and resistance and the idea of a trading range.
- The advantage of such simple signal is that it is easy to interpret in terms of the components and it helps you focus on volume and details of the bar chart.
- The Volume and True range metrics are rate of change parameters which means that they will be high when these parameters are changing. If the volume remains unchanged from day to day the volume part of the index will fall to zero. If the volume doubles or drops to half the volume part will be 100%.
- To get a high value of VPRS all three parameters must be high - i.e. There needs to be a major change in volume, the true price range and the closing price needs to be close to the high price for the day.
- To get a low value of VPRS all three parameters must be low - i.e. The volume and true price range have to be unchanged and the closing price needs to be close to the low price for the day.
- A rapid rise in value from a deep trough is the key pattern that is used as a buy signal. This is used for screening stocks.
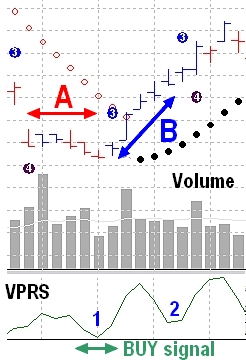
Example 1 - The example shows a stock that has been steady for 5 days with only small changes in the price range and the close price is towards the low price for the day. Prices have been falling. The VPRS is moderately low and trends downward with the decline in closing price. (A)
The stock then enters a buying phase, with a trough (1) and a rise in the VPRS marked by closing prices being close to the high for the day. Volume increases as the price rises and there are major changes in the daily range, which doubles twice in successive days (B). The price rise continues but the VPRS declines because the volume remains steady and there is little change in the price range. A second trough and rise in VPRS (2) is triggered by the volume change, the variability in the price range and the closing price being close to the high for the day.
The trough labelled '1' can be used as potential 'BUY' signal for screening stock. The open and closed 'dot' on the graph are the symbols for the Parabolic SAR index. It is significant that the VPRS trough (1) occurs much earlier in the price surge than the change in the Parabolic SAR.
VPSR provides an early warning system for stocks that are showing changes in the way they are being traded that may herald a price surge. A stock screener or filter can be used to list stocks which have shown VPRS troughs similar to that in Example 1. Users can use charts, trends and other parameters to decide whether the trough is a good BUY signal.
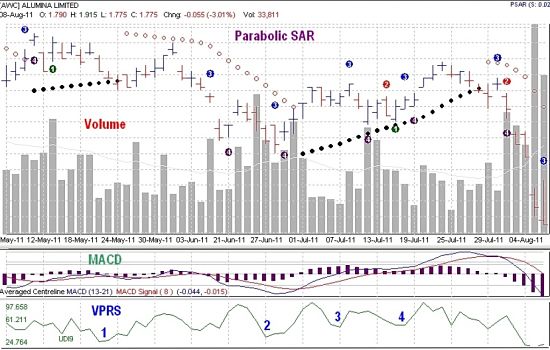
Example 2 - Shown is a 3-month Daily Chart for AWC on the Australian Stock Exchange. The chart included OHLC Bars, Volume, Parabolic SAR, MACD and VPRS. Four BUY trigger signals are shown as troughs for VPSR. In each case the troughs preceded a surge in prices, and Trough 1 and 2 corresponded with cross-over signals from MACD and the second trough was correlated with buy signals from both MACD and Parabolic SAR but the VPRS signal occurred 3 days earlier. Trough 3 was a false signal with the rise only lasting one day. Three of the four troughs would have let to price increases if the BUY signal had let to shares being bought.
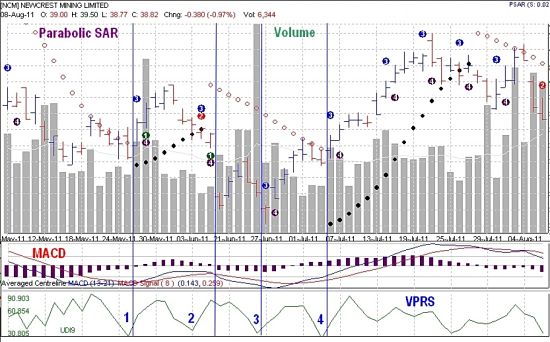
Example 3 - Shown is a 3-month Daily Chart for NCM for the Australian Market. Only the second of the four trough signals was false and the other three proceeded significant price rises. Trough 2 was clearly recognised as false as the price trend was downward. The trough signal should be confirmed as indicating a price surge before buying the stock.
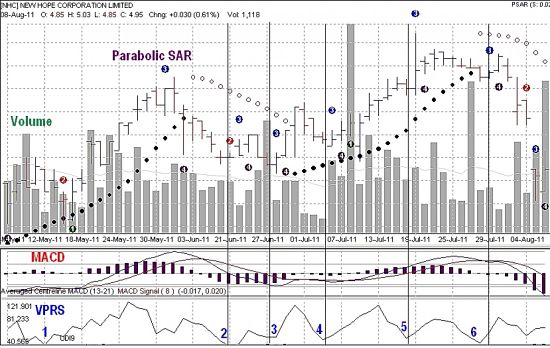
Example 4 - Shown is a 3-month Daily Chart for NHC on the Australian Market. All six VPRS troughs preceded rises in stock prices. For Troughs 1 and 3/4 the increases were substantial. The price rises that followed the other 3 troughs were smaller. Trough 5 and 6 clearly occurred at the end of a price surge and Trough 2 could be considered as part of the 3/4 surge.